On this page
NYC Excess Mortality Explained Without New Virus
In the first wave of covid, excess mortality in New York City was 27 thousand people. Judging by that number alone, it was worse than 9/11, but the global outcry was smaller. After all, 9/11 was malicious and CoViD-19 was a natural (death) cause, according to the majority.
I believe that the coronavirus and CoViD-19 are fictional. If true what was the cause of the large excess mortality in New York City ?
A number of bloggers have already investigated this disaster, foremost Jessica Hockett, her index and tweet.
(The annex is in Dutch)
The death toll
We look at New York City because the excess mortality (in %) was the highest in the world (perhaps after Bergamo. In April 2020, New York City’s share of covid and total mortality (ACM) in the US was 22 percent, with 2 .5 percent of the population.
Nearly nine million people live in the city. One thousand die every week; in 2019 from week 11 to 22: 11,140.
In the same period in 2020: 38,155, which is 27 thousand more, an unimaginable disaster.
[The gap with the number of covid deaths -18-thousand- was closed with the suspicion that many deaths wrongly lacked a covid stamp. After the March-May wave, this counter reached 20 thousand in mid-July.]
Excess mortality in NYC started in week 11 and rose rapidly from 400 to 7,000 (wk 15) then falling to 300 in week 22.
The increase in week 15 was a whopping 644 percent, over the 12 weeks 243 percent and over the whole of 20 51 percent. In the rest of the year, excess mortality was low.
This is the excess mortality in a bar graph. [9/11 resulted in 2 extra bars (base height)]
[ The Netherlands has twice as many inhabitants and we would see an excess mortality of 54 thousand. According to the dutch CBS, the excess mortality was 15 thousand or 10 percent, in all of 2020. ]
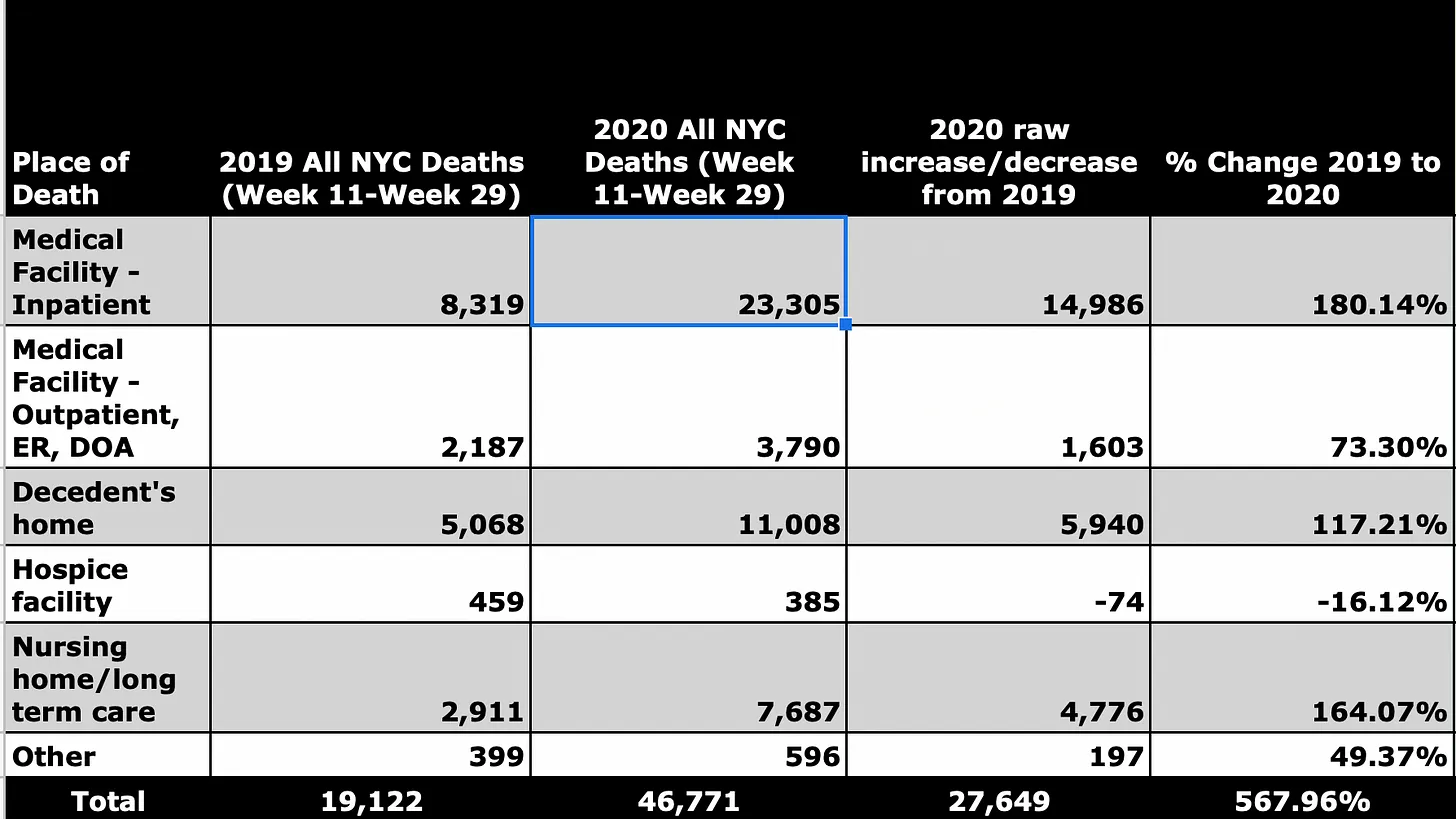
This table indicates where the excess mortality (raw increase) took place. source JH
[ The third row says 5,000 New Yorkers normally die at home and 6,000 more in the spring of ’20. In the second row the ambulatory patients and ER visits; Dead on arrival is a low number. ]
Unnoticed spread?
Before we see what the real causes were of the excess mortality, we will check whether any virus was the cause.
It seems impossible for a virus to kill 17,000* people in three months, coming and going suddenly.
The alleged virus was first seen through a test on February 29. The first infection was reported on March 3. Six days later, there were 16 confirmed cases in New York City. On March 14, the first death.
Around March 15, the municipal schools, clubs, bars and restaurants were closed. source
Researchers later estimated that there were as many as 10,700 cases on March 1.
If there were so many – or more – cases then, how many in February and January? All those thousands infected had no serious symptoms, did not seek medical help ?
The long incubation period and asymptomatic spread doesn’t solve this – assuming both exist (here; Dutch only.
Then in February a huge number of people would have infected each other unnoticed. In such a city, without measures, that number can rise to a million in a month, right?
Such a scenario does not fit with the morbidity and mortality figures just mentioned. A response with this conclusion
See Where was Covid on the lack of excess mortality (and ambulance calls) up to week 11.
Conversely, if there were only a hundred cases on March 1 how could the virus spread so quickly in two weeks and kill tens of thousands? The alleged disease was not that deadly (CFR is low) so such a death toll needs a case population of many millions.
If the virus can spread so quickly, why did it disappear within a few weeks, at least the related mortality?
[ I assume that little changed in the normal mortality rate in New York City. In ’17, only 1881 people died from pneumonia and 96 percent from other causes. ]
* Total excess mortality was 27 thousand and 17 thousand were alleged covid deaths. That last number is wrong on two levels: a The true number is zero, b Very often covid was wrongly entered on the death certificate.
What was the cause of the excess mortality?
On this page I discuss the errors in medical care that lead to unnecessary deaths, the so called iatrogenic damage. It is the basis for diagnosing the New York City disaster. All factors at a glance:
- Avoiding hospitals;
- Psychosomatic disease; get sick from fear
- No treatment; send patients home
- Wrong therapy in hospitals and nursing homes
- Intubation – too many, too soon
- No antibiotics, but midazolam and others
- Not enough to drink and eat
- Isolation and neglect -partly due to:
- Low staffing and no family visits/support
- Difference between black/latino and white.
We start with the largest factors: 1, 3 and 4, which caused damage in two groups of disease: respiratory complaints and heart failure. 2 and 5: see Annex.
In brief: almost everyone with a suspected covid-like illness (CLI) went to the hospital and other patients (particularly with heart complaints) stayed away.
Avoiding care with heart complaints (1)
In the first week of April, 911 was called two thousand times for a cardiac arrest, which is four times as many as normal (500 + 1500. source
In 1429 cases the outcome was fatal, which is eight times normal; 180 + 1250.
Normally, one third of the emergency cases are fatal (180/500), in April this was two thirds (1400/2000.
The arrests were greater in number than normal, and far more lethal
The article opens with the halving of the number of emergency treatments in hospitals.
In that one week, the excess death toll from cardiac arrest was 1250 people.
Confirmation comes from the FDNY. They reported 2,192 deaths at home in two weeks (3/20 – 4/5) four times the number in 2019.
On Sunday, they fielded 187 calls for cardiac arrest, where they would have to try to revive people on site. They used to get 20 of those a day.
Remember: the number of heart attacks has been fairly constant over the years, see chart.
This chart and table gives NYC excess deaths by disease, for all of ’20 (excess deaths after the spring wave was almost nil so these are the numbers for that wave. They are the non-covid deaths on the death certificate.
Source CDC -for the chart choose Weekly Number of Deaths by Cause Group (and New York City for jurisdiction) ; for the table choose Total number above average by cause.
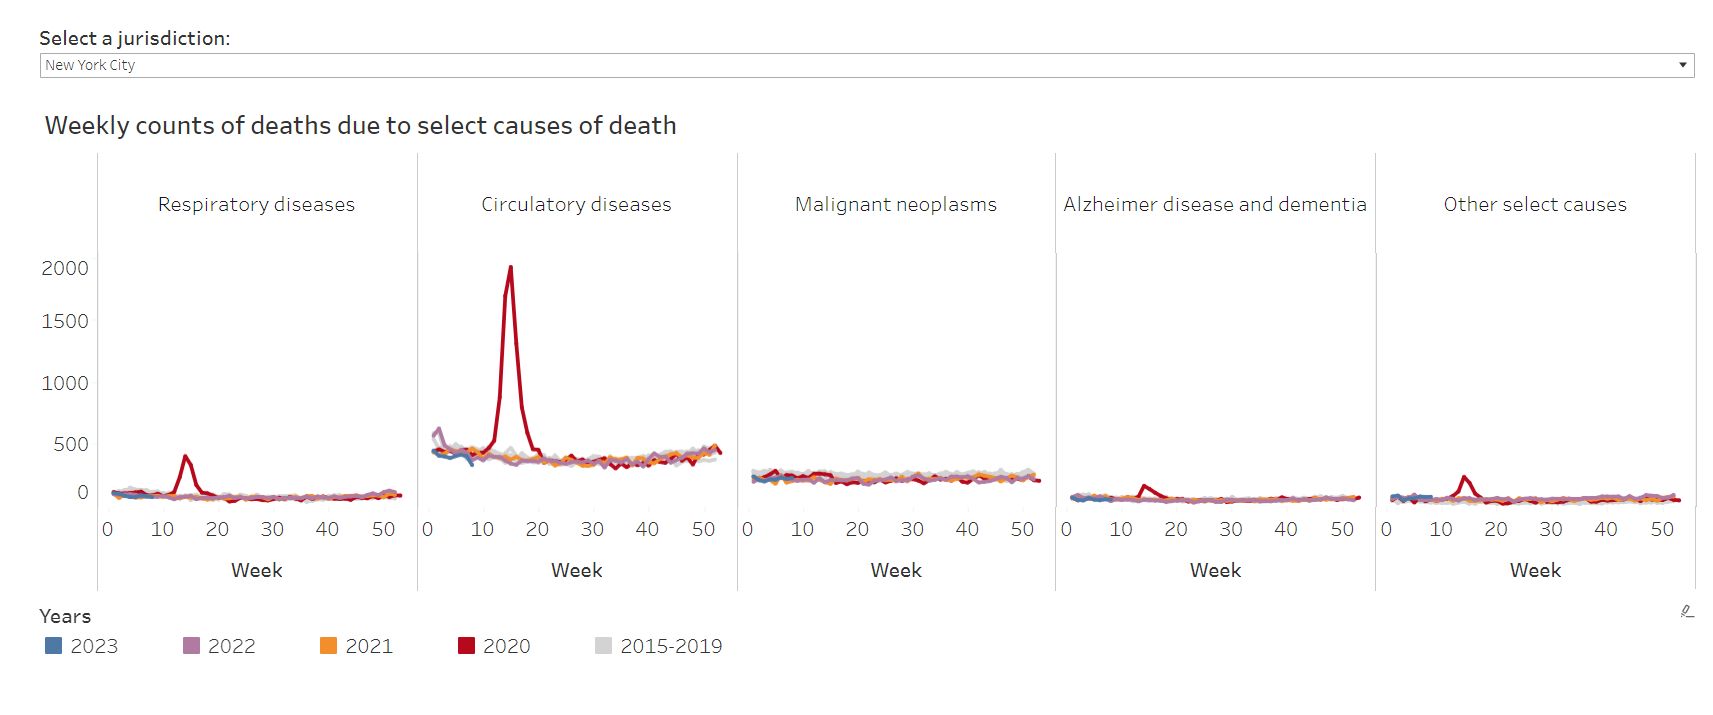
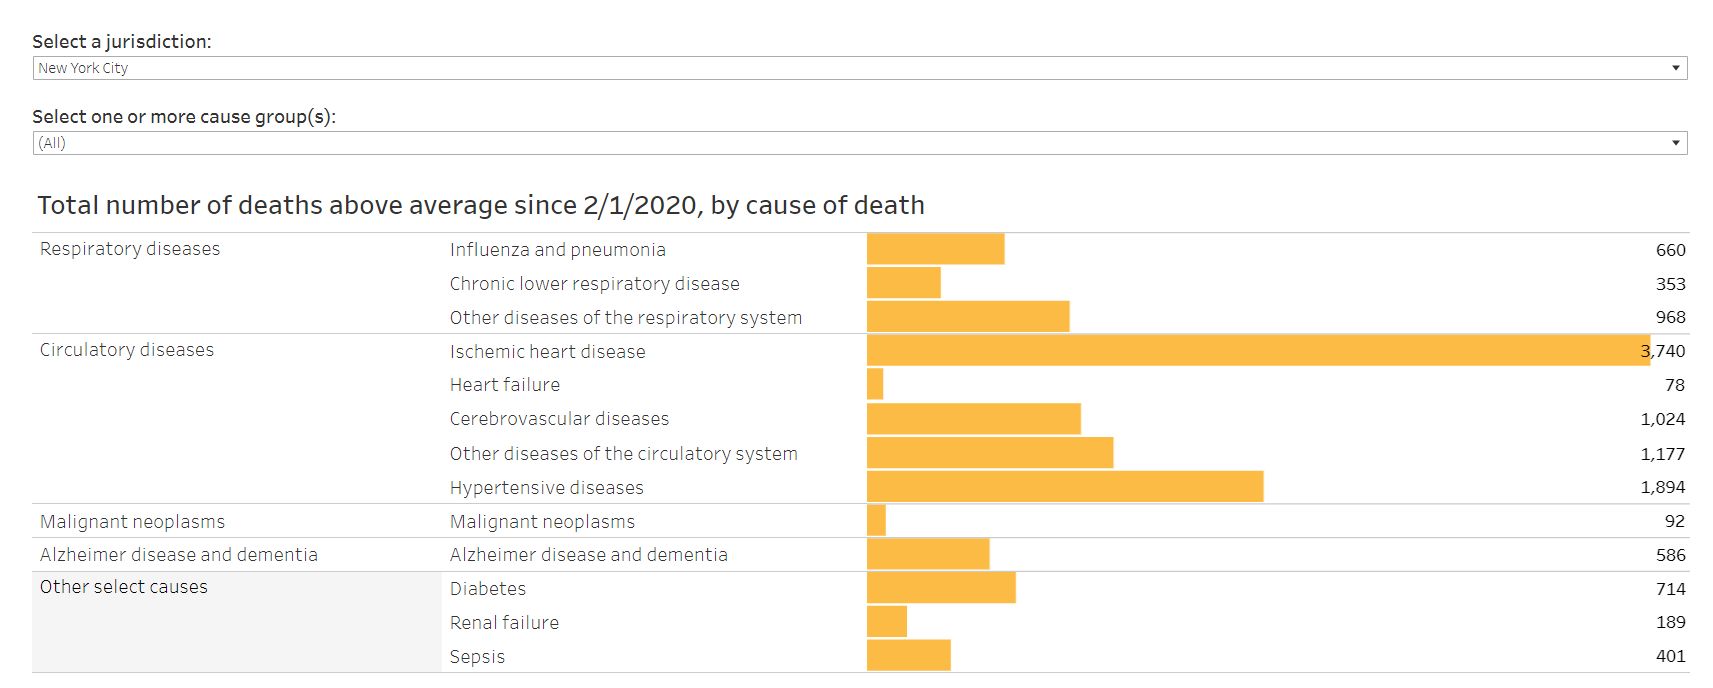
Circulatory diseases is by far the largest cause of death (non-covid): almost 8 thousand cases. That fits well with 1250 in a week.
What is the explanation for this size?
Because of the fear of infection in a hospital, people with mild heart complaints did not dare to call 911 or go to an emergency room. As a result, they did not receive treatment on time and called 911 when it was too late: “far more lethal”.
In Italy, the association of cardiologists investigated the death wave and found
the organization of the hospitals… in this phase was dedicated almost exclusively to Covid-19 and many cardiological wards were used for infectious patients.
Furthermore, for fear of contagion, patients delay access to the emergency room and arrive at the hospital in increasingly serious conditions, often with arrhythmic or functional complications, which make therapies that have proven to be life-saving such as primary angioplasty much less effective.
Source – analysise of the c-wave in Italy -search for ‘ciro’ [ It’s not known whether dedicating cardiology departments to covid was so detrimental (in Northern Italy and NYC) because there were far fewer patients coming in.]
Three pitfalls in respiratory complaints; (1, 3 and 4)
There were many more calls to 911 and more people rushed to the ED with respiratory complaints: 3 to 4 thousand a day (in the previous weeks around 2 thousand) at the same time as a sharp drop in all ED visits.
Graphs and quote from this page (Hockett)
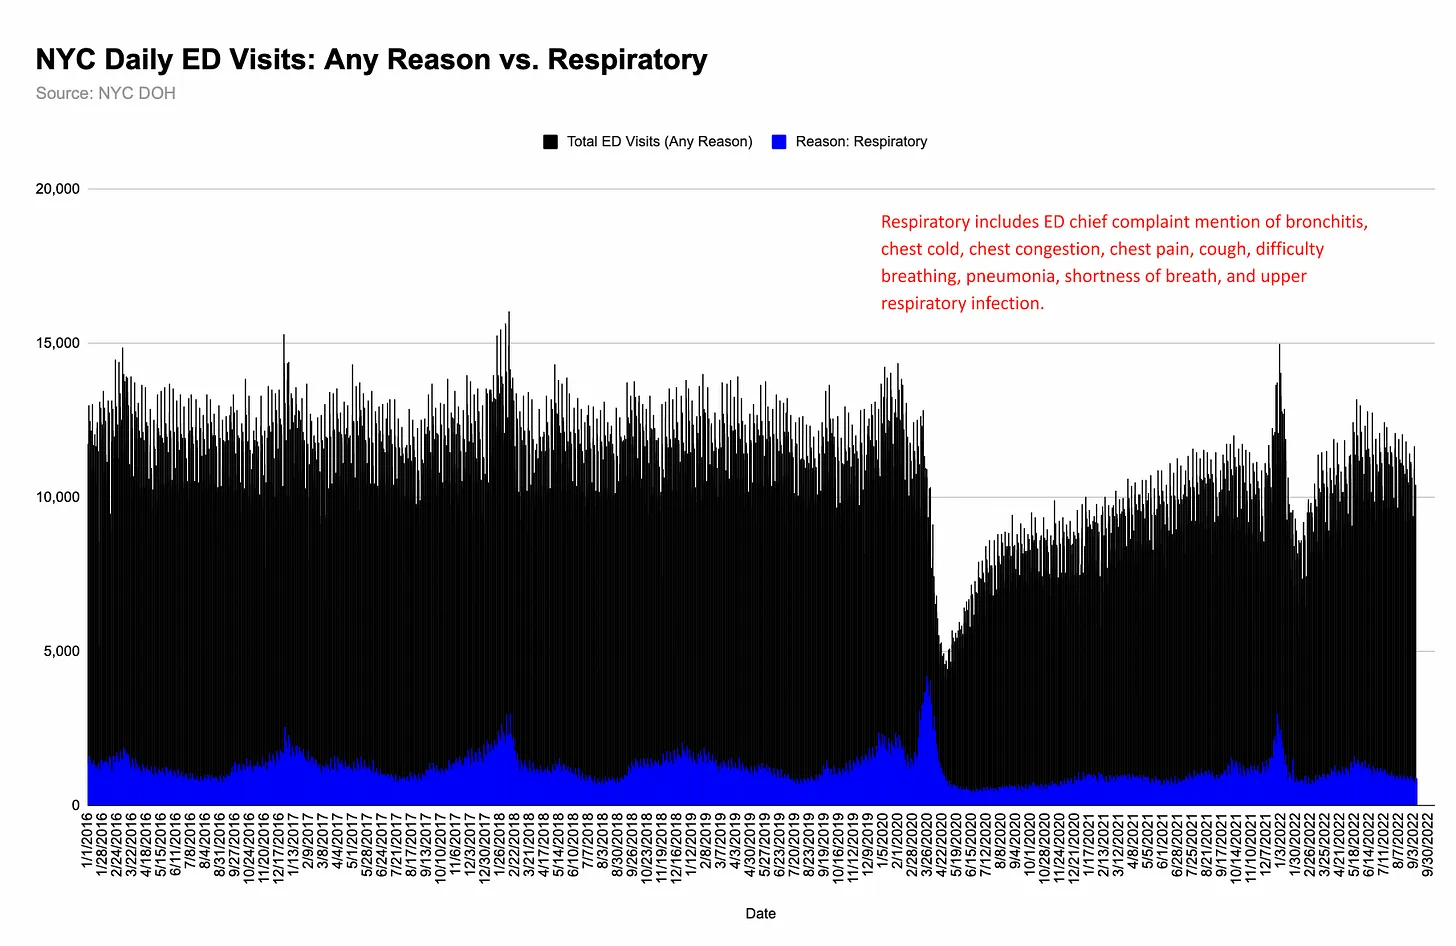
For the month starting March 9, I calculate a number of 100 thousand visits versus 55 thousand in proportion to the average over the period 1-1 to 8-3 (1730/day.
[The NYC Dept. of Health defines CLI as: ILI (Influenza-like illness), pneumonia or the coronavirus and ILI is fever and cough / sore throat / shortness of breath or difficulty breathing, or flu. A wide range of complaints. more about this]
What happened to those 100,000 visitors is largely unknown. Most were sent home; Hockett:
Peak hospital admissions for covid-like illness (CLI) were 40% of respiratory emergency department visits — another data point that hints at folks rushing to the ER at the first sign of a cough.
The question is: what proportion of emergency room visits with respiratory complaints led to hospitalization in ’19? That can also be 40 percent.
Basically: without a new virus, pneumonia/SARS (and flu) were occurring at a normal rate.
The blue peak above was caused by panic; people went to the ED with a slight cough, this large group was rightly sent home, got better on its own and had no mortality, let alone excess mortality.
What was different in 2020 ?
Those with treatable pneumonia fell into one of these traps, in the panic phase.
- Staying at home, due to fear of entering the hospital (1);
- Going to the ER and being sent home without proper treatment* (3)
- Being admitted and receiving the wrong treatment (4) and a wrong label: covid-19.
* Many pneumonias can heal with antibiotics and supplemental oxygen through the nose, at home or in a clinic depending on the severity.
In 2020 (roughly) the same amount of pneumonias were treated worse or not at all, compared to normal.
There were tens of thousands of people in each group. If a fifth or a third per group died from the pitfalls mentioned, then their total is 10 or 20 thousand.
[ In the table below, the CDC report a low excess mortality due to respiratory complaints: a few thousand. This is due to incorrect labeling. ]
Fear in the hospitals leads to mistakes (4)
Most important is intubation (mechanical ventilation) in combination with midazolam. That has already been researched for New York and the surrounding states. Michael Senger looked back (Oct ’22) at excess mortality being much higher in New York, New Jersey and Massachusetts than in other states; nearby states like Maine saw no excess mortality in April. According to him, the use of ventilators was the cause. He notes that in the states mentioned there was more propaganda for this than elsewhere. Thinking was narrowed to
If a person comes in and needs a ventilator and we don’t have a ventilator, the person dies. NYC Governor Cuomo
About 2500 to 3000 additional ventilators are needed to get all city hospitals through next week. NYC mayor Bill de Blasio
Shipments of devices from other states or China were received with cheers.
Senger cites a study (4/20/20) of New York City mortality. A finding: of the over-65s who were intubated, only 3 percent survived. Without intubation, 73 percent survived. Among the 18-65 year olds, the figures were 24 and 98 percent.
He calculated how many people died from the ventilator and other errors by choosing the (low) excess mortality in Michigan as the base-line and comparing the mentioned states with it.
The result: over 17 thousand in New York City, over 7 thousand in New Jersey and 800 in Massachusetts, among others. For all areas combined, the toll totals 30 thousand deaths.
[His numbers are too accurate: 17,289 for NYC, for example. The calculation is crude because the zero line is difficult to determine. And 17 thousand is more than the 15 thousand excess hospital deaths; that value is too high. ]
Excess mortality in nursing homes (4)
In 2020, 7,700 residents of nursing homes died in this period, 4,800 more than in ’19: 2,900. Two-fifths of that excess mortality was attributed to CoViD-19 (various numbers around 2000; with presumed covid much higher but then we are deeper in the fog.
Even in the dominant story about three thousand deaths are not explained.
Intubation and avoiding treatment were occurred less in nursing homes. But a lot of other mistakes: no antibiotics but midazolam, too little to drink and eat, isolation and neglect, no support from family.
Numbers ? The preceding CDC table gives 500 excess deaths for dementia/Alzheimer’s and the graph shows constant deaths by week. That condition does not develop in a few weeks. We can assume that a lot of death certificates stated CoViD-19 as the primary cause, all wrong in my opinion. Apparently, 500 cases lacked a positive test and covid symptoms: surely the victims of said mismanagement. It is certain that the number is higher, but how much ?
And then there was the nursing home scandal; Governor Andrew Cuomo was accused of mismanagement: 9,000 covid patients were transferred from hospitals to nursing homes. 2800 went back, 6300 were new in a nursing home. How many nursing home residents died in a hospital?
Hockett checks whether the assumed damage (mortality) is correct. A good effort but she uses a lot of covid numbers (which are always misleading), no ACM, and the distinction between State and City is not clear.
Discussion
We’ve seen probable causes for New York City’s Spring 2020 excess mortality in this article. It didn’t take a new virus.
However, the fictional virus quickly became a cause for panic, which led to all kinds of measures, disruption in the healthcare sector and avoidance of healthcare.
The excess mortality due to heart failure (8 thousand) is the most accurate number. It is in line with the 1250 per week and the excess mortality ‘at home and outpatient/ED’.
[ These deaths were covid-labeled much less often than other deaths. Almost all pneumonias received that label, which explains the low reported excess mortality for this group, see the graph and table under Avoiding care with heart complaints. ]
[ Of course not all excess deaths at home are due to heart failure alone: there were deaths from heart failure in the hospitals and nursing homes and there were deaths at home from other causes. ]
Subtracting the 8k from the total excess mortality (27k) we have 19k victims from all other mistakes. That happens to be the raw increase in ACM for hospitals and nursing homes combined.
It really looks like the factors from the three previous paragraphs being responsible for this excess mortality, even though the numbers are less clear than the heart failures at home.
As mentioned, Senger’s estimate for intubation deaths (17k) is too high, but my rough estimate for respiratory complaints was 10-20k.
The numbers support the no-virus hypothesis.
Many covid dissidents suspect or presume that the authorities had bad intentions, but I don’t. We are facing a chain of ignorance, groupthink, panic and mistakes. The basis is the wide-spread belief in viruses and contagion. Such a misconception will lead to disasters.
Chosing intubation and the detention of (demented) elderly people seems outrageous, but both were more or less logical for the virus-faithful.
Still, can we tolerate persistent ignorance in cure and care ?
There was generous compensation for healthcare facilities in the US for their covid costs and losses. That existed from April 10; it is uncertain how this contributed to the mismanagement.
The no-virus hypothesis puts many controversies to rest:
- The origin of the virus
- The usefulness of alternative medicines (does HCQ cure pneumonia ?)
- Long covid: cannot be a new disease
- Do corona vaccines protect against CoViD-19 ?
Follow-up
What does this outcome say about the corona waves worldwide and those after May ’20? All of the first waves were relatively smaller than in NYC and all of the mistakes mentioned were made everywhere, more or less. Those waves have been explained by the no-virus hypothesis.
Similar research needs to be done for
- the waves in Hubei, Northern Italy (the linked analysis is very good but numbers are missing);
- the second waves that were bigger than the first (but failed to materialize in New York City;
- the first wave in the Netherlands.
Latest change 26 October 2025